
Main Stats:
| Party | Seats | Change | Votes (%) | Change (% pt) | Votes | Vote per MP |
| Labour | 412 | +214 | 33.8 | +1.7 | 9,725,117 | 23,605 |
| Conservative | 121 | -252 | 23.7 | -19.9 | 6,824,610 | 56,402 |
| Liberal Democrat | 71 | +63 | 12.2 | +0.6 | 3,501,004 | 49,310 |
| Scottish National Party | 9 | -37 | 2.5 | -1.3 | 708,759 | 78,751 |
| Sinn Féin | 7 | 0 | 0.7 | +0.2 | 210,891 | 30,127 |
| Others | 7 | +4 | 2.9 | – | 841,835 | 120,262 |
| Reform UK | 5 | +5 | 14.3 | – | 4,103,727 | 820,745 |
| Democratic Unionist Party | 5 | -3 | 0.6 | -0.2 | 172,058 | 34,412 |
| Green | 4 | +3 | 6.8 | +4.1 | 1,941,220 | 485,305 |
| Plaid Cymru | 4 | +2 | 0.7 | +0.2 | 194,811 | 48,703 |
| Social Democratic and Labour Party | 2 | 0 | 0.3 | -0.1 | 86,861 | 43,431 |
| Alliance | 1 | 0 | 0.4 | 0 | 117,191 | 117,191 |
| Ulster Unionist Party | 1 | +1 | 0.3 | 0 | 94,779 | 94,779 |
| Workers Party of Britain | 0 | 0 | 0.7 | – | 210,194 | |
| Alba | 0 | 0 | 0 | – | 11,784 |
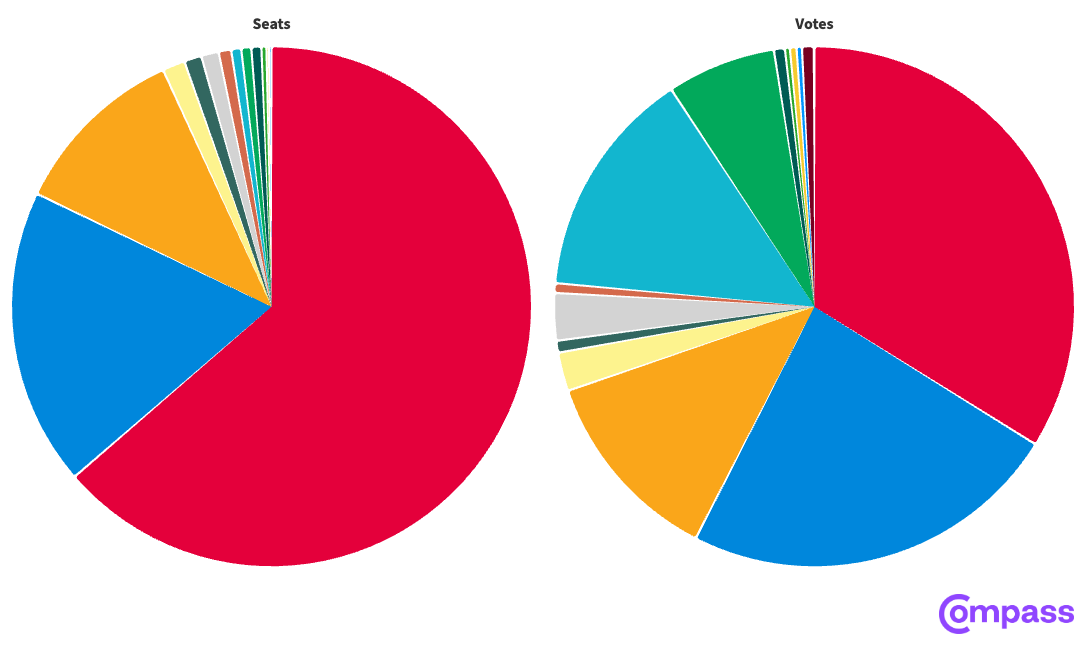
Seat Share versus Vote Share:
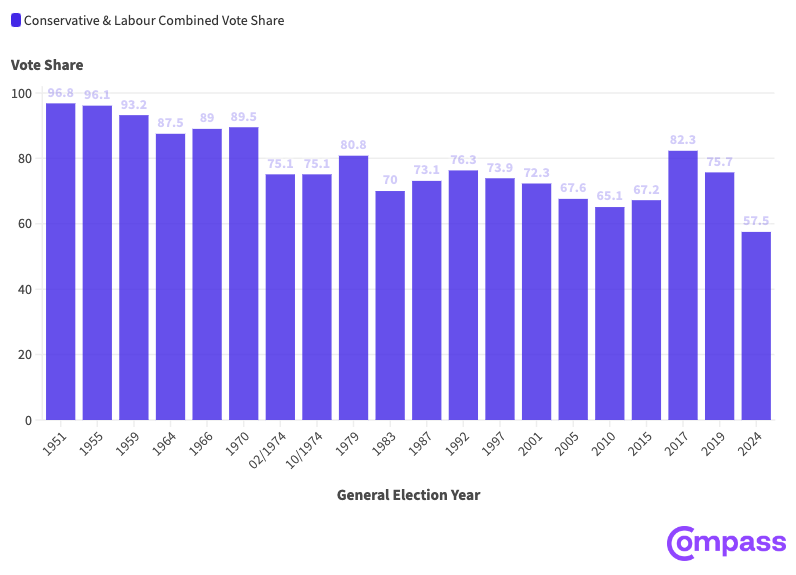
Historical Low vote share for the two main Parties:
Main Headlines:
- Number of Endorsed Candidates Elected (out of 41):
- 35 Endorsed Candidates got elected (85%)
- Number of Progressive Tragedies:
- 101 Tragedies or 83.5% of all Tory Seats
- Green Kingmakers:
- 44 seats or 6.7% of all seats
- Number of Regressive Tragedies/Reform Kingmaker:
- 202 seats or 31.0% of all Seats
- Number of Seats where Greens are second:
- 40 seats or 6.2% of all seats
- 39 Labour
- 1 Speaker
- 40 seats or 6.2% of all seats
- Number of Seats where Reform are second:
- 98 seats or 15% of all seats
- 9 Conservative
- 89 Labour
- 98 seats or 15% of all seats
- Number of Seats where LibDems are second:
- 27 seats or 4.2% of all seats
- 1 Plaid Cymru
- 20 Conservative
- 6 Labour
- 27 seats or 4.2% of all seats
- Wasted Vote in the UK (%):
- 74.82% or 21,476,949 votes
- Effective Vote in the UK (%):
- 25.18% or 7,324,863 votes
- Seat numbers for Parties under PR (proportional seat numbers based on vote share):
| Party | Votes won | Vote % | # Seats allocated based on votes | % of seats |
| Labour Party | 9698720 | 33.73% | 219 | 33.69% |
| Conservative and Unionist Party | 6824783 | 23.73% | 154 | 23.69% |
| Reform UK | 4114287 | 14.31% | 93 | 14.31% |
| Liberal Democrats | 3500961 | 12.18% | 79 | 12.15% |
| Green Party | 1941540 | 6.75% | 44 | 6.77% |
| Scottish National Party (SNP) | 708759 | 2.46% | 16 | 2.46% |
| Independent | 564243 | 1.96% | 13 | 2.00% |
| Plaid Cymru – The Party of Wales | 194811 | 0.68% | 5 | 0.77% |
| Sinn Féin | 210891 | 0.73% | 5 | 0.77% |
| Workers Party of Britain | 210105 | 0.73% | 5 | 0.77% |
| Democratic Unionist Party – D.U.P. | 172058 | 0.60% | 4 | 0.62% |
| Alliance – Alliance Party of Northern Ireland | 117191 | 0.41% | 3 | 0.46% |
| Ulster Unionist Party | 94779 | 0.33% | 2 | 0.31% |
| SDLP (Social Democratic & Labour Party) | 86861 | 0.30% | 2 | 0.31% |
| Yorkshire Party | 17227 | 0.06% | 1 | 0.15% |
| Independent Network | 13663 | 0.05% | 1 | 0.15% |
| Trade Unionist and Socialist Coalition | 12562 | 0.04% | 1 | 0.15% |
| Traditional Unionist Voice – TUV | 48685 | 0.17% | 1 | 0.15% |
| Social Democratic Party | 34020 | 0.12% | 1 | 0.15% |
| Speaker seeking re-election | 25238 | 0.09% | 1 | 0.15% |
Number of Our Local Group Endorsed Candidates Elected:
- Endorsed Candidates Elected:
- Witney
- Brighton Pavilion
- Honiton and Sidmouth
- Cities of London and Westminster
- Stratford-on-Avon
- South Cotswolds
- Banbury
- Aylesbury
- Waveney Valley
- Bicester and Woodstock
- North Devon
- Henley and Thame
- Wokingham
- Tunbridge Wells
- Horsham
- Didcot and Wantage
- Lowestoft
- Harrogate and Knaresborough
- York Outer
- Kensington and Bayswater
- Wycombe
- North Cornwall
- Rushcliffe
- Westmorland and Lonsdale
- Hazel Grove
- North East Somerset and Hanham
- Lewes
- Chesham and Amersham
- Worthing West
- Macclesfield
- St Ives
- Truro and Falmouth
- Morecambe and Lunesdale
- Cheadle
- Camborne and Redruth
- Endorsed Candidates NOT Elected:
- Tatton
- Exmouth and Exeter East
- Suffolk Coastal
- Herne Bay and Sandwich
- Wetherby and Easingwold
- Godalming and Ash